
What Are Grid Reports
Grid reports display your business ranking positions across multiple geographic points. These reports use a map-based visualization system. Each point on the grid represents a different location within your service area.
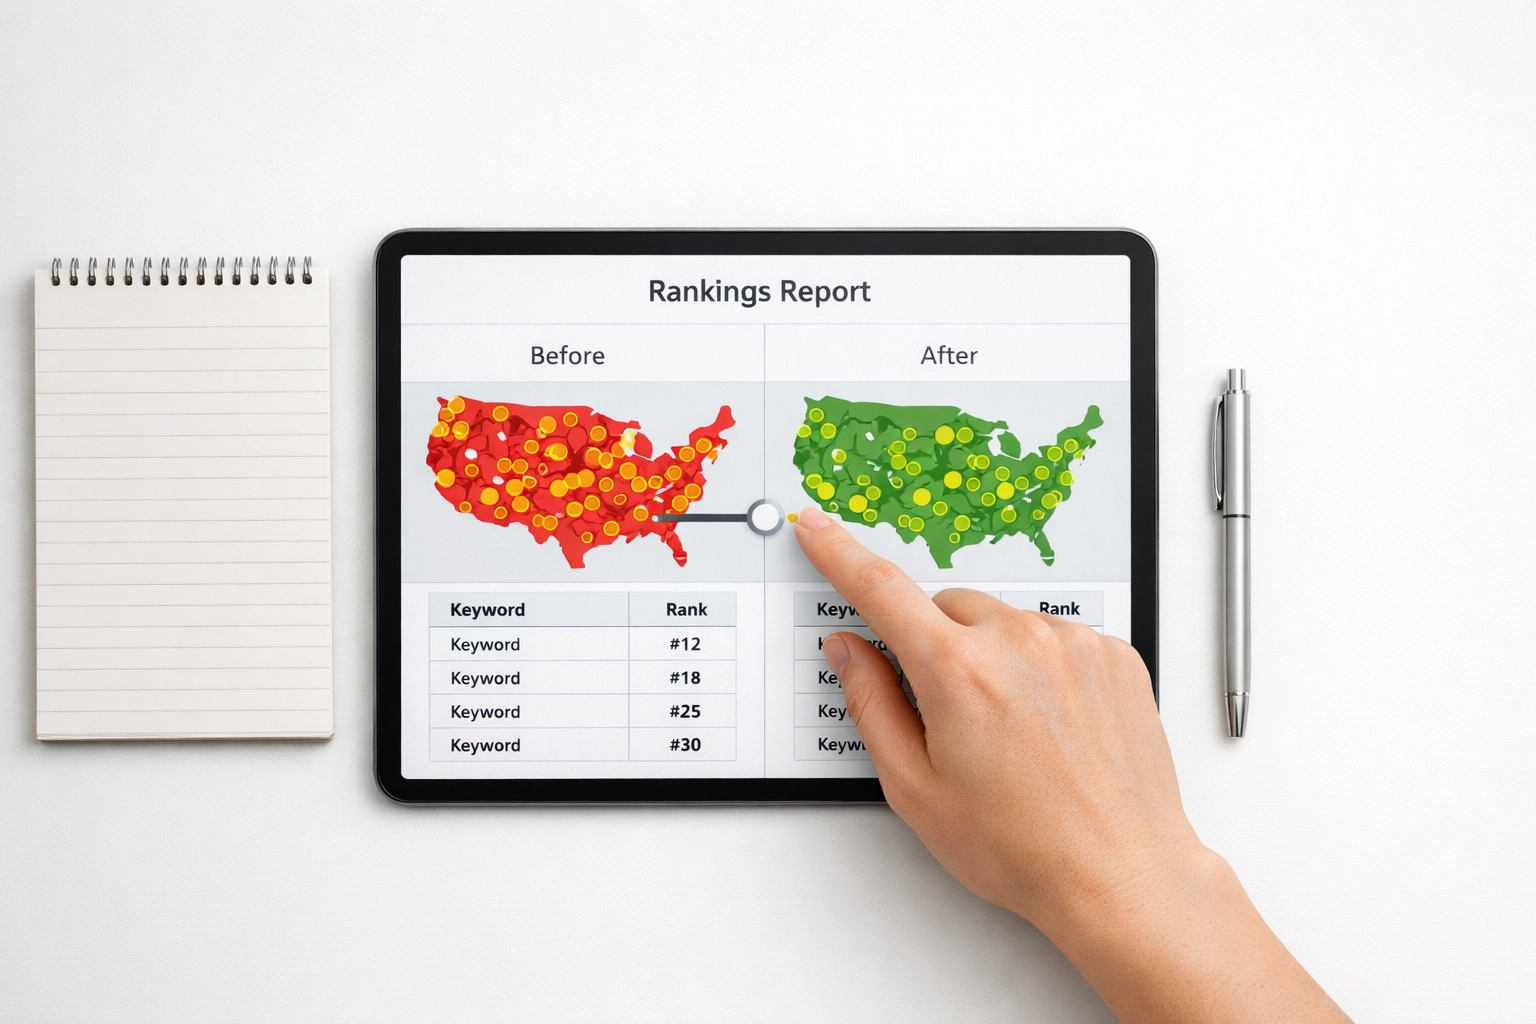
The reports show where your business appears in local search results. Color coding indicates ranking strength at each location. Green typically means strong visibility. Red indicates weak performance.
How Grid Reports Function
Grid reports overlay a customizable grid on your business location map. Common grid sizes include 5×5, 9×9, or larger configurations. Each intersection point represents a unique geographic coordinate.

The system performs search queries from each grid point. It records your ranking position for specified keywords. Results are compiled into a visual map showing performance across your entire service area.
Grid size selection depends on your business needs. Smaller grids work for compact service areas. Larger grids suit businesses serving multiple cities or regions.
Reading Grid Report Data
Grid reports use color-coded systems for quick interpretation. Top rankings appear in green or blue shades. Mid-range positions display in yellow or orange. Poor rankings show in red.
Each grid point includes numerical ranking data. Numbers indicate your position in search results. Position 1-3 typically means map pack visibility. Higher numbers indicate lower placement.
Reports often include competitor data alongside your rankings. This allows direct comparison at each grid point. You can identify locations where competitors outperform your business.

Key Benefits of Grid Reports
Grid reports identify specific areas with weak visibility. This allows targeted optimization efforts. Resources can focus on neighborhoods with the greatest opportunity.
The reports reveal geographic patterns in your rankings. You may discover strong performance in certain districts. Other areas may require additional local SEO work.
Competitor analysis becomes location-specific. You can see which businesses dominate in particular neighborhoods. This information guides competitive strategy development.

Progress tracking is simplified with grid reports. Monthly comparisons show ranking improvements across specific locations. Visual changes make results easy to communicate to stakeholders.
Available Grid Report Tools
Multiple platforms provide grid reporting functionality. Grid My Business offers dedicated grid tracking services. The tool focuses specifically on local ranking visualization.
BrightLocal includes grid reports within broader local SEO tracking. The platform combines grid data with citation tracking and review monitoring. This provides comprehensive local search analysis.
Local Falcon extends grid tracking beyond Google. The tool monitors Apple Maps rankings. It also tracks visibility on AI platforms like ChatGPT.
Places Scout offers grid reporting with customizable parameters. Users can adjust grid density and keyword targets. The platform includes automated reporting features.
Setting Up Grid Reports
Start by defining your service area boundaries. Identify the geographic region where customers search for your services. This determines grid placement and size.
Select target keywords for tracking. Choose terms customers use when searching for your business type. Include both general and location-specific keywords.
Configure grid density based on service area size. Dense urban areas may require tighter grid spacing. Suburban or rural regions can use wider spacing between points.

Establish a tracking schedule. Weekly or monthly tracking captures ranking changes. Consistent timing allows accurate trend analysis.
Interpreting Grid Report Patterns
Strong performance near your physical location is common. Rankings typically decrease with distance from your business address. This reflects Google’s proximity bias in local results.
Gaps in coverage indicate optimization opportunities. Areas with consistently poor rankings need attention. Consider creating location-specific content for these neighborhoods.
Competitor dominance patterns reveal market dynamics. If one competitor consistently ranks higher across multiple points, analyze their strategy. Review their Google Business Profile, citations, and local content.
Inconsistent rankings across the grid suggest optimization issues. Check for NAP consistency problems. Verify your business information appears correctly across all platforms.
Using Grid Data for Strategy
Grid reports inform content creation decisions. Create blog posts or service pages targeting weak geographic areas. Include neighborhood names and local landmarks in content.
The data guides Google Business Profile optimization. Update your service area settings based on grid performance. Add posts highlighting work in underperforming neighborhoods.
Citation building becomes more strategic with grid data. Focus citation efforts on directories serving weak areas. Target neighborhood-specific business listings.
Review generation can target specific locations. Ask customers from underperforming areas to leave reviews. Mention their neighborhood in review responses.
Tracking Progress Over Time
Compare grid reports month-over-month. Look for color changes indicating ranking improvements. Document which optimization efforts corresponded with positive changes.
Create baseline reports before implementing new strategies. This establishes a benchmark for measuring success. Regular reporting shows the impact of SEO investments.
Track competitor movements alongside your rankings. Note when competitors gain or lose visibility. Investigate what changes they made to their local presence.
Common Grid Report Mistakes
Tracking too many keywords dilutes focus. Select 3-5 core keywords initially. Add more keywords after establishing baseline performance.
Ignoring seasonal variations leads to misinterpretation. Some businesses experience natural ranking fluctuations throughout the year. Account for these patterns in your analysis.
Focusing only on weak areas neglects maintaining strong positions. Continue optimizing areas where you rank well. Competitors constantly work to improve their rankings.
Not correlating grid data with actual business results is a missed opportunity. Compare grid performance with lead volume from different areas. This validates the connection between rankings and revenue.
Next Steps
Grid reports provide clear visibility into local search performance. The visual format makes complex ranking data accessible. Regular monitoring enables data-driven optimization decisions.
Start with a basic grid configuration. Expand coverage as you understand the patterns in your market. Use the insights to guide your local rank tracking efforts.
Combine grid data with other local SEO metrics. Review count, citation consistency, and website traffic all contribute to local visibility. A comprehensive approach delivers the best results.